
The index, made simple
How the ParaguayInmo Index is calculated
The ParaguayInmo Index combines four property signals into a score from 0 to 100. It helps you decide which listings deserve a closer look.
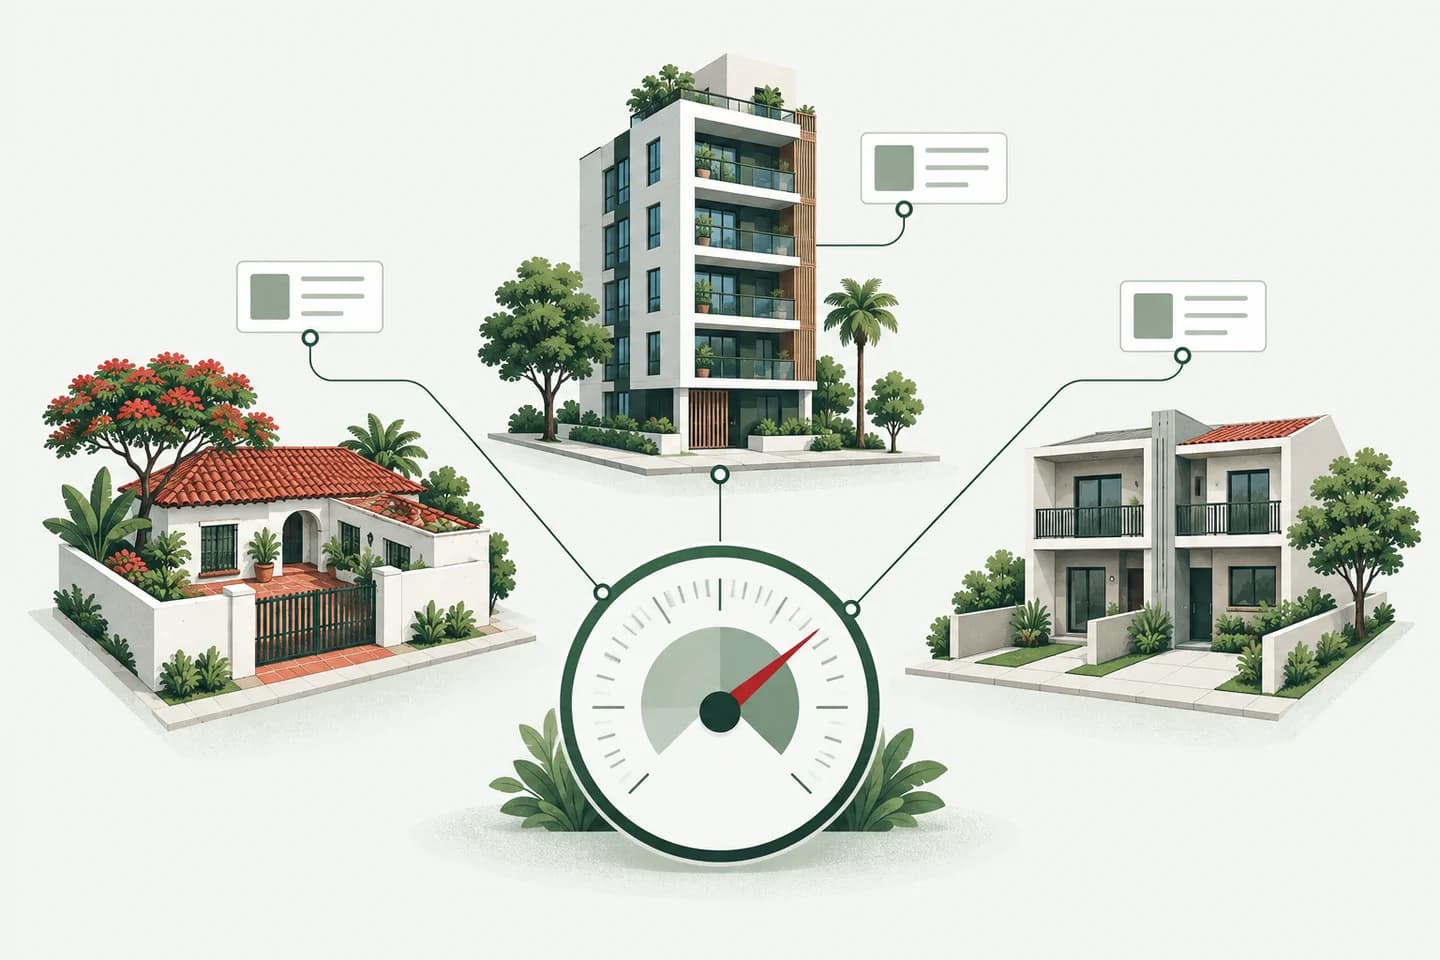
First: how do you read it?
A higher number means the available signals are more favorable under our model. An 80 does not mean an 80% return or 80% certainty.
0–39
Low
40–59
Medium
60–79
High
80–100
Very high
01 / 03
Four questions. One index.
Each signal gets its own score. These are their weights when all four are available.
Price
35%
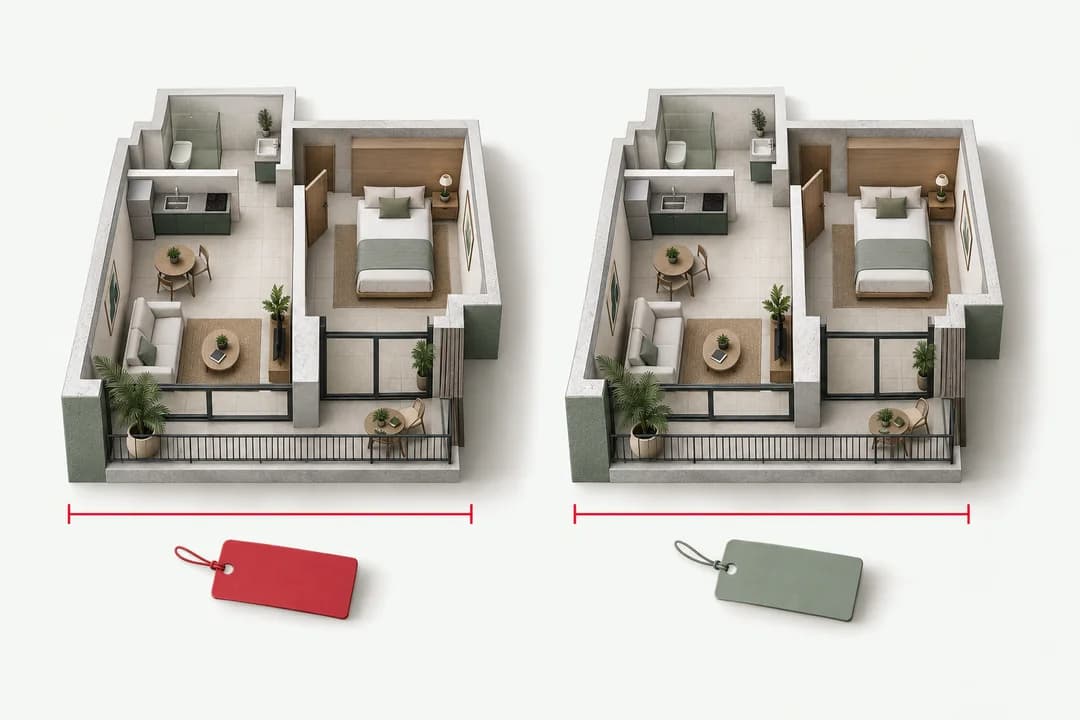
How does the price compare?
We compare the price per m² with similar properties. A price below the reference generally adds points; a higher price reduces them.
With fewer comparables, the price difference has less influence.
Location
25%

What do we know about the area?
We consider location precision, the number of nearby comparables and the area's price level within the city sample.
It does not measure safety, school quality or travel times.
Estimated rent
25%

What rent might it generate?
For sales and development projects, we estimate monthly rent from similar listings and relate it to the purchase price.
This is gross rent: expenses, taxes and vacant months are not deducted.
Listing data
15%

How much information is available?
Price, area, photos, coordinates, comparables and the advertised currency contribute points.
Called “Risk” on the listing. More points mean more support in these data, not less legal risk.
02 / 03
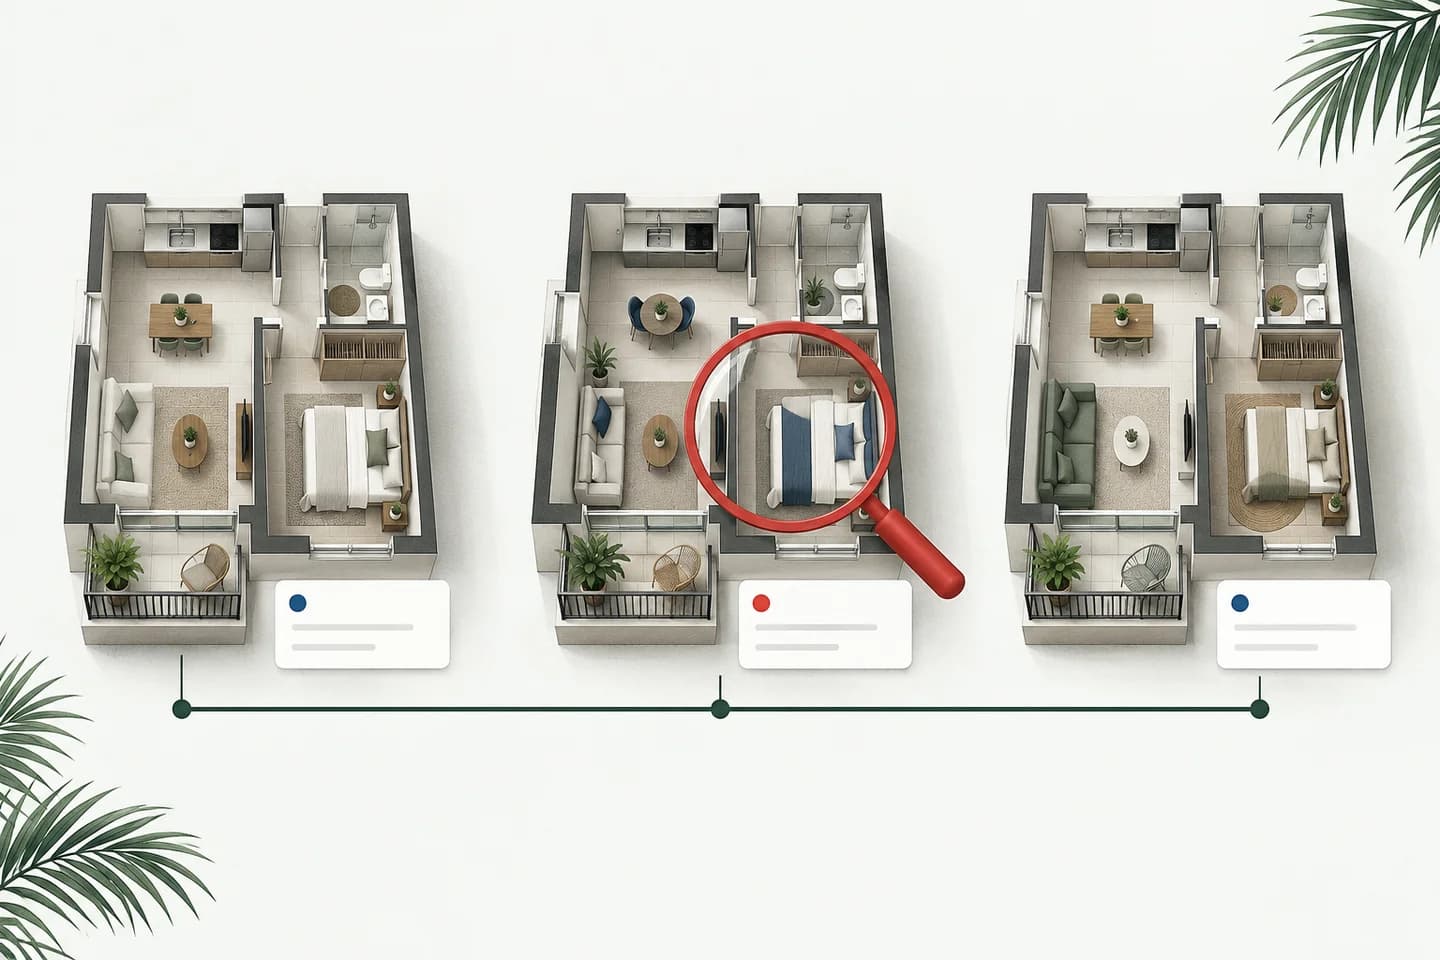
We compare like with like.
Apartments are compared with apartments; houses with houses. We look for the same transaction type, similar sizes and geographic relevance. Bedroom count also matters.
- 1Find similar listings.
- 2Take the middle price per m²: the median.
- 3Compare the property with that reference.
03 / 03
Move the price. See what changes.
This fictional apartment has 100 m². Comparables, location and listing data stay fixed. Changing the price changes both the price comparison and estimated rent relative to the purchase.
Fictional example · not a valuation
- Comparable reference
- USD 1.000/m²
- Assumed monthly rent
- USD 500
Índice ParaguayInmo
78/ 100
4/4 available signals
Index contribution
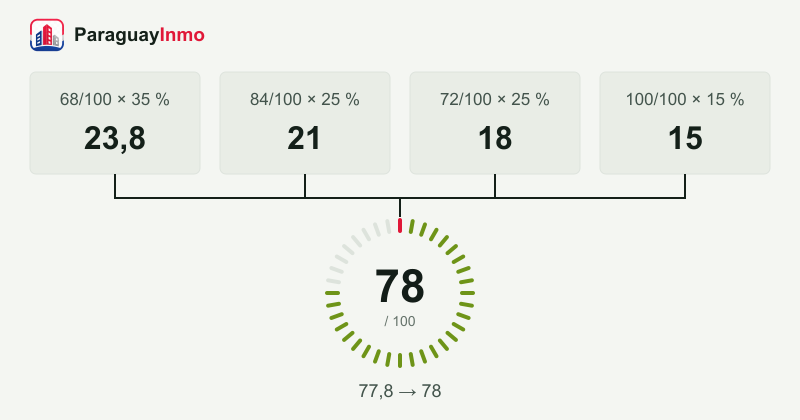
68/100 × 35 %
84/100 × 25 %
72/100 × 25 %
100/100 × 15 %
Effective weight · Rounded to a whole number
How the number comes together
In the initial example, each score contributes a part: 23.8 + 21 + 18 + 15 = 77.8. Rounded, the result is 78.
A guide. The decision is still yours.
- 01
Prices are asking prices, not completed transaction prices. The score can change as the data changes.
- 02
This calculation does not verify ownership documents, debts, permits or the property's physical condition. Arrange a visit and review the documents.
- 03
A high index does not guarantee a good deal. Identical scores can have very different breakdowns and amounts of information.
See the formula
For those who want the full calculation
Current methodology · heuristic model v2. Open each section to see the rules behind the example.
1. The total and missing signals
Each subscore is rounded and limited to 0–100. We multiply each available score by its weight, add them and divide by the sum of available weights. The result is rounded. With no signals at all, the function returns 0; that is not an assessment supported by data.
Index = round(Σ(score × weight) / Σ(available weights))
2. Price: reference and sample size
r is the listing's price/m² divided by the comparable median; n is the comparable count, with at least 3 required. At r = 1, the subscore is 60. The n/(n+4) factor moderates differences in small samples. In the example: r = 0.9 and n = 8 → 68 points.
Price = clamp(60 − (r − 1) × n/(n + 4) × 120)
3. Location: what adds points
Base: exact 78, street 68, neighborhood 58, city 42. Same-zone comparables: +4 for 1–3, +8 for 4–7, +12 for 8+. Total sample: +3 for 5–9, +6 for 10+. Area price percentile: +5 from 0.5 or +10 from 0.75. This is a model rule, not evidence that expensive areas will appreciate. Example: 68 + 8 + 3 + 5 = 84.
4. Rent: a gross estimate
Monthly rent requires at least 3 rental listings of the same type, geographic relevance and 0.4–2.5 times the property's area. We use median rent/m² and the subject's area. Annual rent/price × 100 gives gross yield; its subscore is 10 × that percentage + 5, limited to 0–100. Above 18% annually, the signal is omitted as implausible. Rental listings do not receive this signal.
Gross yield (%) = estimated monthly rent × 12 / price × 100
5. Data: the component called “Risk”
Available price +15; usable area +15; at least 3 photos +15; coordinates +15. Comparables: +5 for 1–3, +15 for 4–7, +25 for 8+. Currency: USD +15, PYG +10. These are model conventions; coordinates do not prove exact location, and currency does not guarantee stability or safety. The example receives 100 points.
6. How comparables are selected
Price comparisons require the same transaction and property type. Where sizes exist, the allowed range is 0.55–1.7 times the subject's area. Neighborhood, district or proximity (reference radius: 2.5 km) matter; place names can help when coordinates are missing. Candidates are ranked by geography, size, bedrooms and distance; up to 12 are kept. With enough data, extremes are filtered. PYG and USD are normalized and plausibility limits apply. These are listing samples, not a census of all transactions.

Now the number has context.
Open a listing and read its index alongside its price, location and comparables.